The main source of Scottish Government statistics on education can be found at http://www.scotland.gov.uk/Topics/Statistics/Browse/School-Education
The index page http://www.scotland.gov.uk/Publications/2010/03/22111037/0 gives access to a wealth of analysis of school leaver attainment by ethnicity, gender and deprivation. More detail on SQA attainment available in schools and education authorities is available through the ScotExed website (for which you need a username and password).
This table shows how attainment levels are improving across the board, but that the gap between the bottom 20% and the rest is widening.
Lowest attaining 20% |
Remaining 80% |
All S4 pupils |
Difference between lowest attaining 20% compared to remaining 80% |
Difference between lowest attaining 20% compared to all S4 pupils |
|
1998/99 |
54 |
190 |
162 |
136 |
108 |
1999/00 |
54 |
194 |
166 |
140 |
112 |
2000/01 |
53 |
196 |
167 |
143 |
114 |
2001/02 |
53 |
197 |
168 |
144 |
115 |
2002/03 |
53 |
197 |
168 |
144 |
115 |
2003/04 |
53 |
199 |
170 |
146 |
117 |
2004/05 |
51 |
199 |
170 |
148 |
119 |
2005/06 |
53 |
202 |
172 |
149 |
119 |
2006/07 |
53 |
201 |
171 |
148 |
118 |
2007/08 |
54 |
204 |
174 |
150 |
120 |
2008/09 |
59 |
209 |
179 |
150 |
120 |
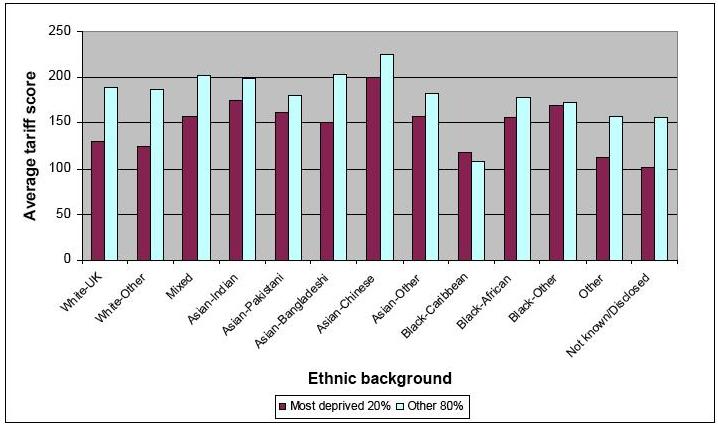
Data on the average tariff scores of school leavers is available from http://www.scotland.gov.uk/Publications/2010/03/22111037/0 and shows wide differences.
This chart shows the average tariff scores of school leavers plotted by ethnicity and levels of deprivation. The gap is widest for white UK (especially boys, though this isn’t shown in the chart), and narrowest for most young people with Asian backgrounds.
The table below shows levels of exclusion by deprivation. Key questions arising from this data are:
Number of exclusions |
Number of temporary exclusions |
Number of removals from register |
Number of pupils at census (1) |
Rate per 1,000 pupils |
|
Most Deprived |
14,416 |
14,380 |
36 |
144,643 |
100 |
Least Deprived |
1,756 |
1,753 |
3 |
130,801 |
13 |
(1) Pupil numbers as at September 2008.
There are similar wide variations in exclusion levels by ethnicity and family circumstances. Full sets of data are available at http://www.scotland.gov.uk/Publications/2010/02/15094039/0.
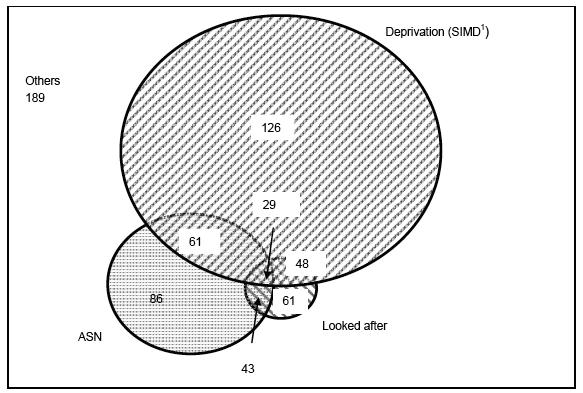
The chart below shows the average tariff score achieved by school leavers grouped by ASN, being looked after, and in the bottom 20% of datazones. It illustrates how barriers can accumulate, so that having additional support needs, being looked after, and experiencing deprivation gives by far the lowest tariff score.